

My First #WorkoutWednesday
I learned some lessons from #TC17: take your time.
There is so much to do and absorb at conference that rushing in and out devalues the experience. This year, we took more team members and arrived in New Orleans early to explore the city. The greatest return on the trip was the experiences the extra time allowed, as I was able to sit for and participate in the #MakeoverMonday session.
This community is amazing, offering brilliant people, compelling design, and fantastic technical and personal development opportunities. In the last two years of using Tableau, I had no idea that #MakeoverMonday or #WorkoutWednesday was a thing.
For the past seven weeks I haven’t missed a single #MakeoverMonday, but I’ve been avoiding #WorkoutWednesday. That was a mistake. These challenges are one of the best ways to expand and develop the personal Tableau toolbox.
The approach
In order to build an effective viz you need to understand the data.
With a pad of paper and a pen, scratch out the logic used in transform the data into a way that will explore the underlying relationships. Table calculations in this workout are not the normal calculations available in the context menu in Tableau, ranking, percent of total, etc.

Where do sub-categories succeed?
Review the #WorkoutWednesday post for 2018 week 49 by clicking the button below.
the execution
Using Sales, let’s review the example step by step process of understanding the logic in the table calculation used to translate the actual values into a value from 0 to 1.
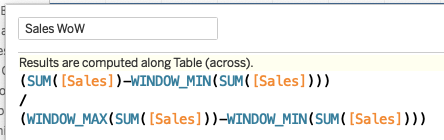
This table calculation is translating the values generated in the view of results into a value between 0 and 1 for each of the dimensions shown. We do this because each of the three measures, Sales, Profit Margin, and Customer Count do not share the same axis.

Let’s look at the Sub-Category of Phones as an example to understand what the calculation is doing.
The Numerator
The SUM([Sales]), is $330,007. The minimum in the window, meaning all of the SUM([Sales]) values for each dimension shown is $3,024 for Fasteners.
$330,007 - $3,024 = $326,983
The Denominator
The window max of sub-categories less the window min of sub categories. This looks at the SUM([Sales]) for the top and bottom of the Sub-Categories in the visual, Phones and Fasteners.
$330,007 - $3,024 = $326,983
$326,983 / $326,983 = 1
We can repeat this logic with the second most of sales with Chairs, with a total sale value of $328,449
$328,449 - $3024 = $325,425
$330,007 - $3,024 = $326,983
$325,425 / $326,983 = .9952
Once the values are created, populating the rest of the dashboard is now a formatting challenge.
I got close this week, but the exact details are off. I’ve ran out of time to obsess over this. I know it’s time to put Tableau away when I get the cross glances from my wife. This was amazing, and I’ll definitely be doing it again.


