

#WorkoutWednesday 2018 Week 50
#WorkoutWednesday (WoW) week 2 in the bag!
Part of my daily responsibilities is to review and approve publication requests from our development server to our production server. Honing the skill of looking at and understanding how Tableau works and how to create a viz greatly improves the accuracy and speed of the approval process. WoW is such an excellent community tool to improve understanding of Tableau.
Let’s review the core challenge for WoW 2018w50.
Make up of sales
View the completed WoW submission on Tableau Public by clicking the button below:
Objective
Look at the existing dashboard. Can you figure out the basics of what is happening before we dive into the formulas and specifics of the sheets?
This weeks challenge is in using a parameter to change the colors and distribution of sales across the pie chart on each state.
Let’s focus on the difficult part: creating the formulas and interactions the dashboard.
Create formulas
With a plan on how to approach the recreation, we can see there are 3 formula types needed:
Identifying the Category from the Sub-Category selection
Sorting and coloring the Sub-Category
Placing the Sales value into three bins:
Sub-Category Name
Category Name
Others
We can identify the Category from the Sub-Category with a simple calculated field:
However, when the Category of the selected Sub-Category doesn’t match, we end up with null values. We’ll be removing the Category field from the visualization and a void additional domain padding, but we’ll need to ensure the parameter selection ends up with a single result, not two. We need only the applicable Category, not Category and a null.
Excellent! Now our parameter selection returns a single value.
Creating a sort
To color and sort the results, we added A, B, or C to the results. This will ensure an easy way to apply sorting to our dashboard.
Creating the category bins
How do we create the Category Split bin?
When the parameter matches a sub-category, show the sub-category (ex. Phones). If the category of the parameter matches the category show a text string “Rest of Category.” All other values are placed in the “All Others” bin.
Putting it all together
Now we create a pie chart and apply the colors.
From here on it’s a formatting challenge.
Happy dashboarding! See you all next week!
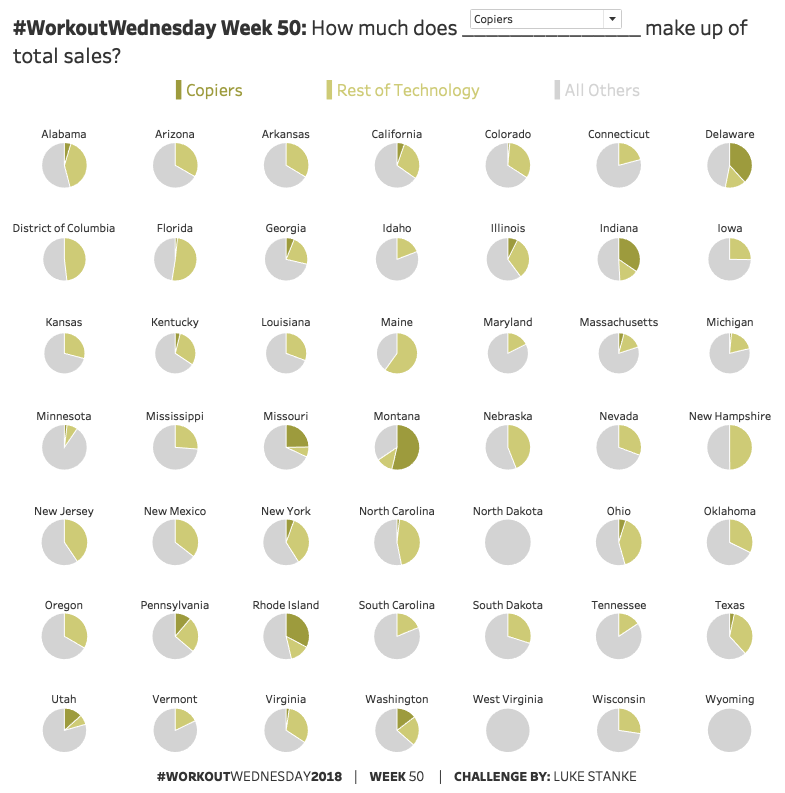
What is the makeup of total sales?
Review the #WorkoutWednesday post for 2018 week 50 by clicking the button below.


