
From Dashboards to Data Platforms: How My Work Has Evolved
It's been a while since I've written here. The last post on this site is from 2019, back when I was deep in Tableau, running #WorkoutWednesday challenges, and evangelizing self-service analytics to anyone who would listen.
A lot has changed.
I'm still at PADNOS, still working with data every day, but my role looks completely different. I went from building dashboards to leading teams. From Tableau Server administration to architecting data platforms. From asking "what chart should this be?" to asking "what problem are you trying to solve?"
This post is my attempt to explain that shift and for anyone trying to figure out where their own data career might go.
Tableau Was the Gateway
I don't regret a single hour I spent in Tableau. It taught me how to think visually, how to ask better questions, and how to communicate with stakeholders who didn't speak data.
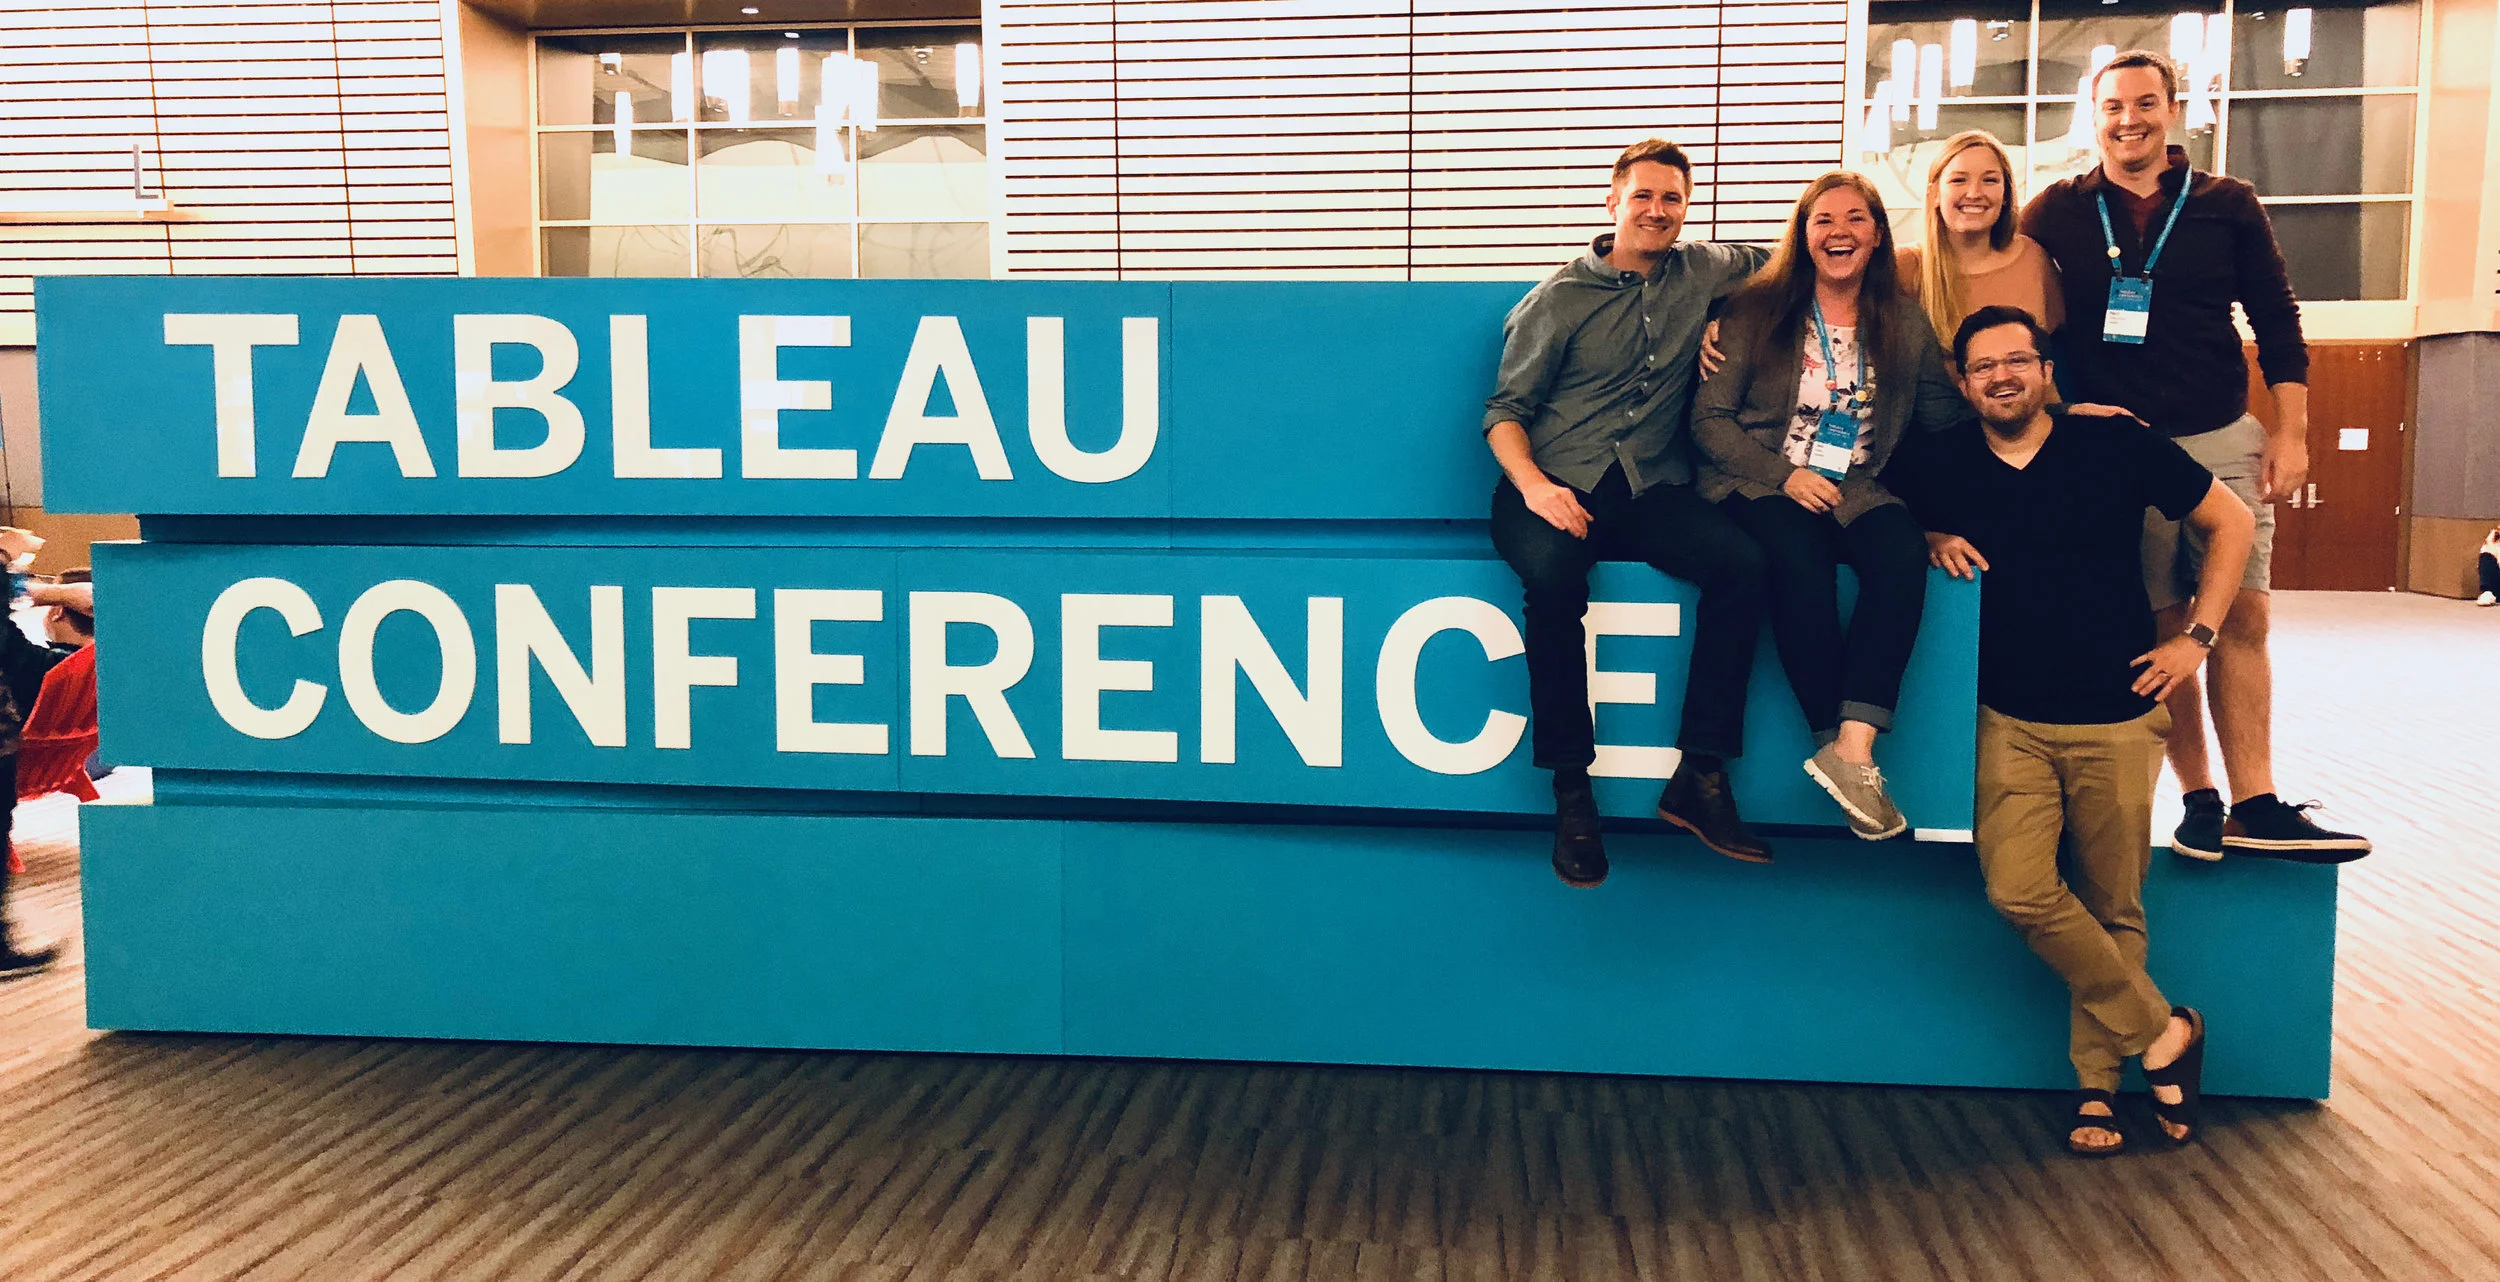
More than that, the Tableau community taught me how to learn in public. Writing blog posts, participating in #MakeoverMonday, attending conferences — all of it made me a better practitioner and opened doors I didn't know existed.
But here's what I started to notice: the dashboards were only as good as the data behind them.
The Real Pain Is Upstream
At some point, I stopped spending my days in Tableau Desktop and started spending them in SQL Server, Python scripts, and API documentation. Not because I wanted to, not because it was glamorous, but because I had to.
The problems that actually blocked our team weren't visualization problems. They were:
Data arriving late, incomplete, or duplicated
Systems that were never designed to talk to each other
Manual processes that broke every time someone went on vacation
"Single source of truth" spreadsheets that weren't single, weren't sources, and definitely weren't true and exploded if someone looked at ‘em wrong
I realized that if I wanted to deliver reliable analytics, I needed to own more of the stack. So I started building pipelines. Writing integrations. Designing data models that could survive contact with the real world.
The job title changed - from Lead BI Analyst to Analytics Manager to IT Manager - but the core mission stayed the same: make it easier for people to trust and use data.
Building Systems Matters More Than Building Charts
Here's the uncomfortable truth I've come to accept: a well-designed data pipeline delivers more value than a beautiful dashboard.
Don't get me wrong, visualization matters. But a chart is a point-in-time artifact. A pipeline is infrastructure. One answers a question; the other makes it possible to answer questions that haven't been asked yet.
Data is the product we ship back to the business. The presentation layer is what customers see - a Tableau dashboard, a website, a CRUD app, a report that lands in someone's inbox. But underneath all of it is the skeleton: the pipelines, the warehouse, the integrations that make it work.
Whether we're connecting a procure-to-pay system to an ERP, pushing enriched data from the warehouse back to a CRM, or feeding a model that flags anomalies before a human ever sees them — it's all the same discipline. The presentation layer changes. The underlying work doesn't.
BI tooling was hot in the 2010s. Now it's AI. But the foundation is still the data. That's the product, from visuals to reverse-ETL.
AI Is the Next Chapter
Have you felt the push to "do AI" but not know what that means? Felt the need to use generative LLMs just to burn tokens? Me too. As an IC it can be confusing and frustrating — chasing hype without a clear idea of what winning looks like.
What I've learned is that doing it well requires leaders who push, but push with direction. Identify the areas where people are actually blocked in their workflows. Find the steps where human attention is the bottleneck. Then use AI as a force multiplier there.
If we're not being pushed, we don't learn. And learning by doing — as an adult — is still the best way to add new tools to the toolbox.
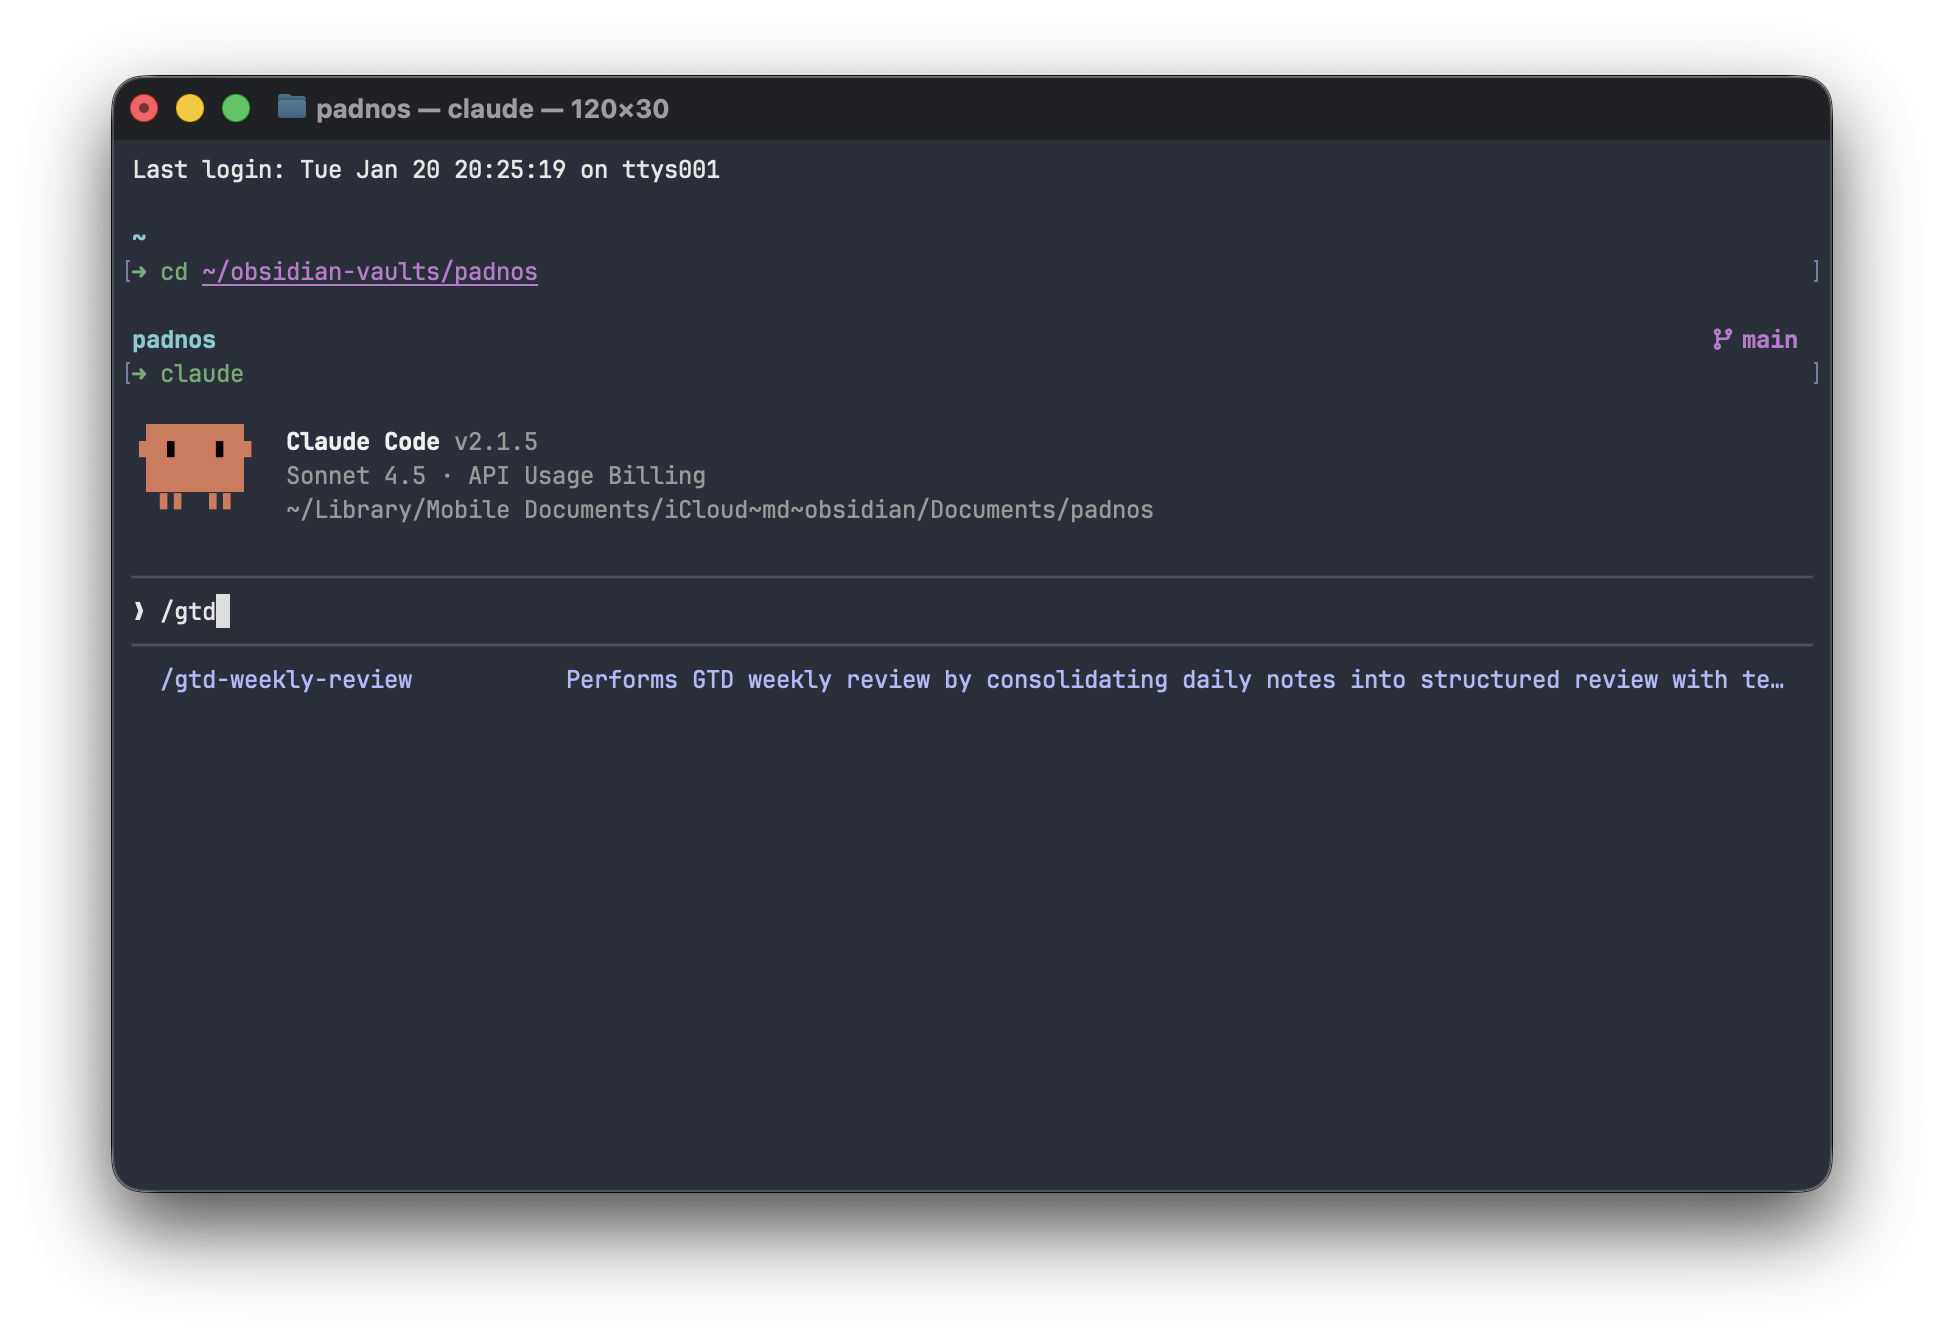
At PADNOS, we've shipped AI projects that actually work. Not because we started with "let's use AI" but because we started with "this process is painful, what would make it better?" Sometimes the answer was a Python script. Sometimes it was a better data model. And sometimes — when the problem fit — it was generative AI.
The pattern I keep coming back to: AI is a multiplier, not a replacement. It amplifies what's already there. If your data is messy, AI makes messier outputs faster. If your processes are undefined, AI can't define them for you.
But if you've done the hard work of building solid data infrastructure? AI becomes incredibly powerful.
What's Next
I'm writing again because I think I have something worth sharing. Not Tableau tips this time (though I still love the tool) but lessons from building data teams, modernizing legacy systems, and figuring out where AI actually fits.
Moving from IC to manager, from a single tool to building the whole stack, took years of heads-down work. I stepped back from the community - from conferences, from writing, from the conversations that shaped how I think about this work.
Now I'm ready for the next challenge: to share and give back.
I miss the in-person conferences. I miss the energy of a room full of data people trying to figure things out together. I miss the conversations that happen in the hallway after a session, the ones where someone says "we tried that too, here's what broke."
If you're a data person trying to figure out your next move, or a leader trying to understand what "data infrastructure" even means, I hope some of this resonates.
More soon.
Jared Duquette is an IT Manager leading data and software teams at PADNOS in Grand Rapids, Michigan. He writes about data infrastructure, AI implementation, and engineering leadership at digitalduquette.com.